Denoising
Contents
Show code cell content
import mmf_setup;mmf_setup.nbinit()
import logging;logging.getLogger('matplotlib').setLevel(logging.CRITICAL)
%matplotlib inline
import numpy as np, matplotlib.pyplot as plt
from IPython.display import clear_output, display
This cell adds /home/docs/checkouts/readthedocs.org/user_builds/iscimath-583-learning-from-signals/checkouts/latest/src to your path, and contains some definitions for equations and some CSS for styling the notebook. If things look a bit strange, please try the following:
- Choose "Trust Notebook" from the "File" menu.
- Re-execute this cell.
- Reload the notebook.
Denoising#
Here we discuss the following denoising model:
\[\begin{gather*}
E[u] = \int\frac{1}{p}\abs{\vect{\nabla}u}^p
+ \frac{λ}{q}\int\abs{u - d}^q,\\
E'[u] = -\vect{\nabla}\cdot\Bigl(\vect{\nabla}u \abs{\vect{\nabla}u}^{p-2}\Bigr)
+ λ(u-d)\abs{u-d}^{q-2}.
\end{gather*}\]
One Dimension#
To better understand what happens, we start by working in 1D.
from math_583 import denoise
Nx = 16
x = np.arange(Nx)
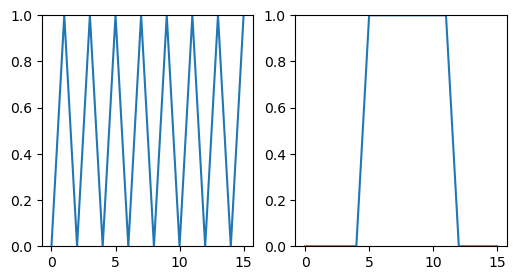
u1 = x % 2
u2 = np.where(abs(x-Nx/2) < Nx/4, 1.0, 0)
us = [u1, u2]
ims = [denoise.Image(data=u) for u in us]
ds = [denoise.Denoise(im, sigma=0) for im in ims]
fig, axs = denoise.subplots(len(ims))
for ax, im in zip(axs, ims):
im.show(im.get_data(), ax=ax)
display(fig)
/home/docs/checkouts/readthedocs.org/user_builds/iscimath-583-learning-from-signals/conda/latest/lib/python3.9/site-packages/scipy/__init__.py:146: UserWarning: A NumPy version >=1.16.5 and <1.23.0 is required for this version of SciPy (detected version 1.23.5
  warnings.warn(f"A NumPy version >={np_minversion} and <{np_maxversion}"
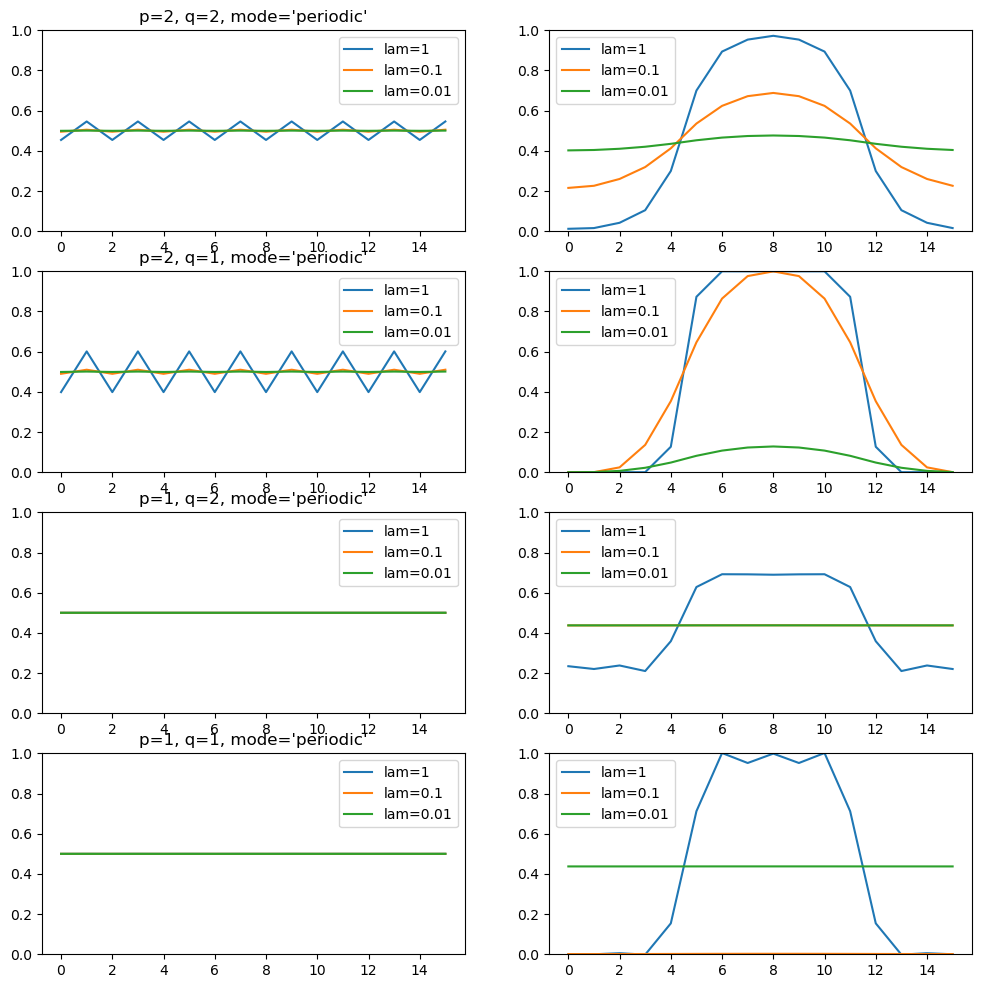
mode = "periodic"
pqs = [(2,2), (2,1), (1,2), (1,1)]
lams = [1.0, 0.1, 0.01]
fig, axs = denoise.subplots(len(ims), len(pqs), aspect=2)
args = dict(eps_p=1e-6, eps_q=1e-6, sigma=0, mode=mode)
for row, (p, q) in enumerate(pqs):
    for col, im in enumerate(ims):
        ax = axs[row, col]
        for lam in lams:
            d = denoise.Denoise(im, lam=lam, p=p, q=q, **args)
            u = d.minimize()
            im.show(u, label=f"{lam=:g}", ax=ax)
        ax.legend()
    axs[row, 0].set(title=f"{p=}, {q=}, {mode=}")
clear_output()
display(fig)