Tools
Contents
Show code cell content
%matplotlib inline
import numpy as np, matplotlib.pyplot as plt
plt.rcParams['image.cmap'] = 'gray'  # Use greyscale as a default.
import mmf_setup; mmf_setup.nbinit()
import logging
logging.getLogger('PIL').setLevel(logging.ERROR)  # Suppress PIL messages
import PIL
This cell adds /home/docs/checkouts/readthedocs.org/user_builds/iscimath-583-learning-from-signals/checkouts/latest/src to your path, and contains some definitions for equations and some CSS for styling the notebook. If things look a bit strange, please try the following:
- Choose "Trust Notebook" from the "File" menu.
- Re-execute this cell.
- Reload the notebook.
Tools#
Here we describe some tools and utilities for working with data etc. in this course. This is not core material, but often needed to get other things done.
Images#
There is a plethora of different image formats. To
deal with this, we use the [Pillow][] (PIL) library which an read, convert, display, and
generally manipulate images. We will use this to convert images into NumPy arrays for
processing, making use of the following formats. Consider an image of size (Nx, Ny)
where there are Nx pixels in the horizontal direction and Ny pixels vertically.
L,shape=(Nx, Ny): 8-bit pixels (dtype=uint8) gray-scale images. Each pixel has a value from 0 (black) to 255 (white). By keeping images in this format, we save space, but often in processing, we will convert to floating point.RGB,shape=(Nx, Ny, 3): Each pixel is represented by 3uint8numbers representing the Red, Green, and Blue channels.RGBA,shape=(Nx, Ny, 4): Each pixel is represented by 4uint8numbers representing the Red, Green, Blue, and Alpha channels. The alpha channel represents transparency, and is used when combining or “blending” images.
Warning
Floating point numbers (double precision or float64) have 64 bits, while uint8 bytes
have 8 bits. Converting an array to double precision will increase the memory usage by
a factor of 8. This can be a problem if you process many images.
from math_583 import denoise
im = denoise.Image()
for mode in ["L", "RGB", "RGBA"]:
    u = np.asarray(im.image.convert(mode=mode))
    print(f"{mode=:4}: {u.shape=!r:13}, {u.dtype=}, {u.max()=}, {u.min()=}")
mode=L   : u.shape=(490, 487)   , u.dtype=dtype('uint8'), u.max()=255, u.min()=0
mode=RGB : u.shape=(490, 487, 3), u.dtype=dtype('uint8'), u.max()=255, u.min()=0
mode=RGBA: u.shape=(490, 487, 4), u.dtype=dtype('uint8'), u.max()=255, u.min()=0
/home/docs/checkouts/readthedocs.org/user_builds/iscimath-583-learning-from-signals/conda/latest/lib/python3.9/site-packages/scipy/__init__.py:146: UserWarning: A NumPy version >=1.16.5 and <1.23.0 is required for this version of SciPy (detected version 1.23.5
  warnings.warn(f"A NumPy version >={np_minversion} and <{np_maxversion}"
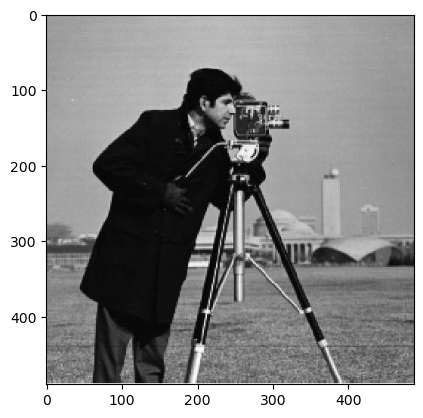
Once you have the image as an array, you can display it using matplotlib, or with PIL.
fig, ax = plt.subplots()
ax.imshow(u)
display(fig)
plt.close('all')  # Otherwise, the matplotlib image will stay open and display below.

display(PIL.Image.fromarray(u))
Warning
Note that [plt.imshow()][] respects the pixel order of PIL with the origin at the upper
left. If you want to plot images in mathematical order, you will need to specify
origin='lower' and specify the extents of the array. See [origin and extent in
imshow][].
If using matplotlib to display a grey-scale image (mode='L'), you will need to specify
the color-map cmap=gray and may need to specify vmin=0 and vmax=255, otherwise you
will get the default viridis color-map with auto-scaled ranges. We often set the
default on import (i.e. in the math_583.denoise package).
Finally, ax.axis('off') is useful.
```{code-cell}
im = denoise.Image()
with plt.style.context({}, after_reset=True):
    fig, axs = plt.subplots(1, 2, figsize=(4,2))
    u = np.asarray(im.image.convert(mode='L'))
    ax = axs[0]
    ax.imshow(u)

    # The right way:
    ax = axs[1]
    ax.imshow(u, vmin=0, vmax=255, cmap='gray')
    ax.axis('off')
```

[`plt.imshow()`]: <https://matplotlib.org/stable/api/_as_gen/matplotlib.pyplot.imshow.html>
[Pillow]: <https://python-pillow.org/>

[*origin* and *extent* in `imshow`]: <https://matplotlib.org/stable/tutorials/intermediate/imshow_extent.html>